Metrics and targets
[ESRS E1-4; GRI 3-3e, 302-4]
For more information, see “Sustainability targets” in the management approach at the beginning of this chapter. All of Lenzing’s sustainability targets and the process of setting and monitoring (ESRS 2 MDR-T 80g, 80j) can be found in the “Sustainability targets, measures and progress” section in the "ESRS 2 General disclosures” chapter. Depending on technology and market developments, further measures for the period of 2030-2040 will be disclosed in the coming years.
Near-term science-based target |
To reduce scope 1 and 2 absolute greenhouse gas (GHG) emissions by 42 percent and scope 3 absolute GHG emissions by 25 percent until 2030 (baseline 2021)f,g |
2030 |
||||
|---|---|---|---|---|---|---|
Long-term science-based net-zero target |
To achieve at least a 90 percent reduction in absolute GHG emissions (scopes 1, 2 and 3) (baseline 2021)f,g |
2050 |
||||
Measure(s) |
Lenzing achieves 100 percent green electricity for four sites |
2024 |
||||
|
Lenzing phases out coal in its Nanjing (China) operations |
2022 |
||||
|
Lenzing installs on-site photovoltaic power generation at the Lenzing plant |
2022 |
||||
|
Lenzing increases the share of renewable energy consumed by the Lenzing Group and supplies excess bioenergy from the pulp production facility in Indianópolis (Brazil) |
2023 |
||||
|
Lenzing’s lyocell facility in Prachinburi (Thailand) achieves scope 1 and 2 carbon neutrality by 2030 by using 100 percent bioenergy and in the medium term achieves 95 percent biomass energy by 2027 |
2030 |
||||
|
Lenzing engages 20 key suppliers, by spend and CO2 impact, in order to reduce Lenzing’s scope 3 emissions and incentivize the suppliers that help Lenzing offer more low-carbon-footprint fibers |
Continuous |
||||
|
Lenzing engages and enables 80 percent of ‘customers with approved SBT and commitment’ (textile and nonwoven brands/retailers as well as manufacturers working with LENZING™ fibers) to fulfill their ambition by providing information on low carbon footprint specialty products such as TENCEL™, LENZING™ ECOVERO™ and VEOCEL™ branded fibers |
2030 |
||||
|
Lenzing runs a campaign to reach 50 percent of TENCEL™and VEOCEL™ customers (textile and nonwoven brands/retailers as well as manufacturers using the TENCEL™ and VEOCEL™brands) to promote the use of innovative lenzing fibers with environmental benefits such as low-carbon intensity and to reduce reliance on fossil based materials wherever possible. |
Continuous |
||||
Progress made in 2024 |
Six production facilities procured 100 percent renewable electricity. Gas pipe connections and constructions in Nanjing (China) have been finished. The product carbon footprint platform of TfS was adopted internally and external trainings are taking place. Lenzing is in continuous discussions with top suppliers and also shares its expertise for obtaining low-impact chemicals (e.g. green electricity and LCA). The site in Prachinburi (Thailand) has been facing some challenges in consistently receiving 100 percent biomass energy due to the reliability of the supply partner’s biomass co-generation plant; however, the site has achieved 100 percent biomass energy for a few months during the year. Therefore, both parties have agreed to work out short-term and long-term technical solutions. The discussion and negotiation on securing biogenic energy to reach 100 percent consistently in the future are ongoing. Additionally, given the current global economic situation, many businesses and end customers have been deprioritizing sustainability in favor of low-cost sourcing and are therefore less willing to pay for low-carbon products. Customer engagement has been taking place to position fiber products with a low carbon footprint to support a reduction in customers’ scope 3 emissions reduction. According to these challenges the measure has been reformulated from “Lenzing achieves scope 1 and 2 carbon neutrality at its new lyocell fiber production site in Prachinburi (Thailand) by using 100 percent bioenergy” to “Lenzing’s lyocell facility in Prachinburi (Thailand) achieves scope 1 and 2 carbon neutrality by 2030 by using 100 percent bioenergy, and in the medium term achieves 95 percent biomass energy by 2027”, and the target year has been extended from 2023 to 2030. The target ambition for customer engagement has been increased form 50 percent to 80 percent of “customers with approved SBT and commitment”. |
|||||
|
||||||
The previous near-term SBT is still relevant for remuneration and corporate targets with same baseline for 2017. Thus, realization and achievement of measures of the updated near-term and long-term SBTs will result in reaching those linked targets.
Previous near-term science-based target |
To reduce scope 1, 2, and 3 (purchased goods and services, upstream and downstream transport, and fuel and energy-related activities) GHG emissions by 50 percent per ton of fiber and pulp sold by 2030 (baseline 2017) |
2030 |
||||
|---|---|---|---|---|---|---|
Linked remuneration target |
Lenzing reduces 40 percent of specific GHG emissions per ton of pulp and fiber sold (baseline 2017)b,e |
2024 |
||||
Linked corporate target |
Lenzing reduces 50 percent of specific GHG emissions per ton of pulp and fiber produced (baseline 2017)e |
2027 |
||||
|
||||||
Lenzing’s responsibility and science-based targets (SBTs)
Lenzing first set SBTs in 2019. In 2023, Lenzing’s SBTs were updated to align with the most recent climate science, and in 2024 they were verified and approved by Science Based Targets initiative (SBTi). The previous targets were 2 °C aligned and expressed as GHG intensity reductions (GHG emissions reductions per ton of pulp and fiber sold). The previous target uses 2017 as the baseline year with specific GHG emissions from that year serving as the baseline value (for the values please see table “Specific greenhouse gas emissions”), which still serves as reference for remuneration and corporate strategy targets. After the update in 2023, the SBTs are now expressed as absolute GHG reductions aligned with the 1.5 °C scenario of the Paris Agreement and the UN SDG 13 on climate action, making them even more ambitious. Both the previous and the updated SBTs are in line with Lenzing’s Bioenergy Policy and Sustainability Policy.
Lenzing’s updated SBTs use 2021 as the baseline year, with total absolute GHG emissions (scope 1, 2 and 3) from that year serving as the baseline value and reference point for tracking progress (for the baseline values, please see table “Absolute emissions of target scope”). The baseline year and value were set to 2021 in accordance with SBTi rules, as 2020 was significantly impacted by COVID-19 and was not representative of typical operational conditions. The 2021 baseline accurately reflects Lenzing’s typical operational activities and emissions, excluding any one-time events or anomalies, ensuring that the baseline is representative of normal operations. In the reporting year, the baseline value was subject to a recalculation (increase of 0.158 million tons GHG emissions), therefore an additional reduction to the tune of 0.066 million tons GHG emissions is necessary to achieve the scope 1 and 2 targets. For further information on the reason for the recalculation, please see the “Accounting principles” section. The target scope for reducing scope 1 and 2 absolute GHG emissions is fully aligned with the boundaries of the GHG inventory, which includes emissions from direct operations and energy use. A market-based method was used to calculate scope 2 GHG emissions included in the target. The boundary of the scope 3 target includes categories 1, 3, 4 and 9, but excludes the category 15 (investments) and covers approximately 97 percent of the reported scope 3 GHG emissions inventory. Furthermore, the targets cover emissions of all greenhouse gases (CO2, CH4, N2O, HFCs, PFCs, SF6, NF3) as defined under international protocols such as the Greenhouse Gas Protocol (GHG Protocol) and are expressed as CO2 equivalents. The targets follow a cross-sector absolute contraction approach (ACA), setting absolute emissions reductions in line with global decarbonization pathways. These pathways are based on climate science and aim to keep the global temperature rise within the limits set by international agreements such as the Paris Agreement, which aims to limit warming to 1.5 °C or well below 2 °C above pre-industrial levels. They have been independently verified and approved by the SBTi to ensure that they align with climate science and SBTi criteria. SBTi uses climate scenarios compatible with limiting global warming to 1.5 °C.
Internal stakeholders, including the commercial, investor relations, strategy, and corporate sustainability teams as well as the Managing Board were involved in the target setting process. In addition, external stakeholders were engaged, including key pulp and chemical suppliers, customers requesting SBTs, as well as multi-stakeholder initiatives such as the UN Fashion Charter, which advocate for commitment to the Paris Agreement. Selected stakeholders were involved through meetings and conferences. The SBTi was involved in verifying the targets and subsequently, in approving the SBTs aligned with the 1.5 °C ambition. The Lenzing team is further engaging with SBTi regarding FLAG targets.
New technologies will play an important role in mitigating CO2 emissions and achieving the GHG emission reduction targets.
For more information about for the decarbonization levers and their overall quantitative contributions to meet the SBTs, see the “Climate Action Plan” (figure “Climate Action Plan”) at the beginning of this chapter. For more information about the actions described by decarbonization levers, please see the “Action” section. Not every action described by the levers is explicitly mentioned as a measure under the targets but still contributes to their achievement.
Lenzing has not yet set a target for its own operations concerning the “Risk for Lenzing’s operations and supply chain due to the increasing chronic physical climate hazards as indicated by climate risk assessment”. However, Lenzing has been prioritizing and addressing key topics in a step-by-step manner while managing resources. The upstream value chain aspects of this risk are addressed through the “Supplier engagement” target, as climate change is part of the environmental pillar of the assessment. This target will further intensify efforts related to climate change adaptation. For more information on the “Supplier engagement” target, please see the “Metrics and targets” section of the “S2 Workers in the value chain” chapter.
The ”Risk of wood scarcity from non-resilient forests and effects of increasing global average temperature” is addressed by the “Conservation projects” target which focuses on engaging in further conservation, biodiversity protection, and restoration activities in regions where forests are at risk, aiming to improve the resilience of forests so they can better adapt to climate change. For more information on the “Conservation project” target, please see the “Metrics and targets” section of the “E4 Biodiversity and ecosystems” chapter. The ‘FEM’ target addresses the following impact, risk and opportunity: Opportunity to de-risk Lenzing’s operations and gain market share by reducing GHG emissions; Negative impact on global climate change by generating GHG emissions with the use of non-renewable energy sources; Risk of reputational damage if sustainability requirements in regard to energy sources are not met and carbon footprint is not reduced. The Higg Facility Environmental Module (Higg FEM) standardizes how facilities can measure and evaluate their annual environmental performance. Energy and GHG emissions are one of the seven categories covered by the assessment. For more information on the “FEM” target, please see the “Metrics and targets” section of the “E3 Water and marine resources” chapter.
Energy and fuels
[ESRS E1-5; GRI 302-1, 302-3]
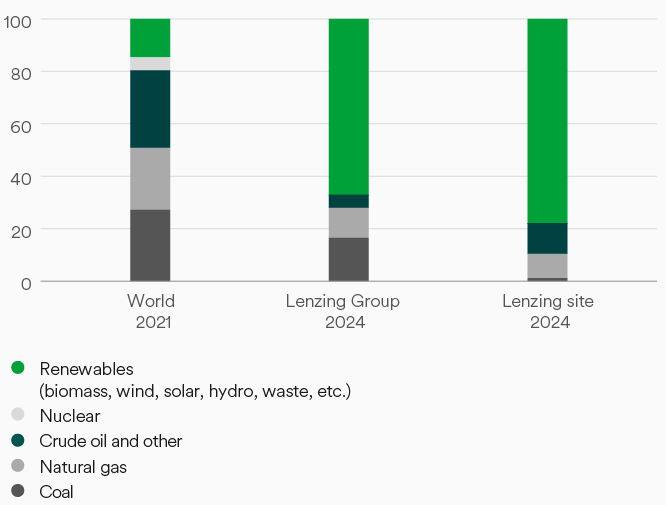
Lenzing’s absolute fossil and renewable energy consumption increased year on year. This is due to an increased production volume of pulp and fiber.
Lenzing, Austria |
Biomass, waste, natural gas and coal |
|---|---|
Heiligenkreuz, Austria |
Biomass, biogas and natural gas |
Paskov, Czech Republic |
Biomass, biogas and natural gas |
Grimsby, UK |
Natural gas |
Mobile, USA |
Natural gas |
Nanjing, China |
Coal and natural gas |
Purwakarta, Indonesia |
Coal and natural gas |
Prachinburi, Thailand |
Biomass and coal |
Indianópolis, Brazil |
Biomass and oil |
Energy sources
Million MWh |
2024 |
2023 |
2022 |
||||
|---|---|---|---|---|---|---|---|
(1) Fuel consumption from coal and coal products |
1.89 |
1.73 |
1.74 |
||||
(2) Fuel consumption from crude oil and petroleum products |
0.37 |
0.42 |
0.08 |
||||
(3) Fuel consumption from natural gas |
1.60 |
1.35 |
1.44 |
||||
(4) Fuel consumption from other fossil sources |
0.44 |
0.52 |
0.50 |
||||
(5) Consumption of purchased or acquired electricity, heat, steam and cooling from fossil sources |
1.16 |
1.03 |
0.82 |
||||
Total fossil energy consumption (calculated as the sum of the lines 1 to 5)a |
5.46 |
5.05 |
4.58 |
||||
Share of fossil sources in total energy consumption (%) |
32.80 |
30.84 |
47.30 |
||||
(7) Consumption from nuclear sources |
0.00 |
0.00 |
0.00 |
||||
Share of consumption from nuclear sources in total energy consumption (%) |
0.00 |
0.00 |
0.00 |
||||
(8) Fuel consumption for renewable sources, including biomass (also comprising industrial and municipal waste of biologic origin, biogas, renewable hydrogen, etc.) |
10.14 |
10.12 |
4.75 |
||||
(9) Consumption of purchased or acquired electricity, heat, steam and cooling from renewable sources |
1.02 |
1.20 |
0.34 |
||||
(10) Consumption of self-generated non-fuel renewable energy |
0.00 |
0.00 |
0.00 |
||||
(11) Total renewable energy consumption (calculated as the sum of the lines 8 to 10)a |
11.16 |
11.32 |
5.10 |
||||
Share of renewable sources in total energy consumption (%) |
67.20 |
69.16 |
52.70 |
||||
Total energy consumptionb (calculated as the sum of lines 6 and 11) |
16.63 |
16.37 |
9.67 |
||||
Energy intensity based on revenue from activities in high climate impact sectors (mn MWh/EUR) |
0.0063 |
0.0065 |
0.0038 |
||||
|
|||||||
For a description of the ESRS 2 MDR-M of the metrics energy consumption and energy intensity, the high climate impact sectors and the line item in the financial statement used to calculate the energy intensity, please see the “Accounting principles” section in this chapter. Figures for energy production are currently not available.
Lenzing’s greenhouse gas emissions
[ESRS E1-6; GRI 305-1, 305-2, 305-3, 305-4]
Lenzing’s carbon footprint

Lenzing’s absolute scope 1 and 2 GHG emissions increased by 0.17 million tons (11 percent) year on year. The main reason is the increased production volume of pulp and fiber.
Scope 1 biogenic GHG emissions slightly increased due to the biomass power station at the Heiligenkreuz (Austria) site now integrated into Lenzing’s operations for the first full year in 2024 as well as due to higher consumption of biomass fuel at the Indianópolis (Brazil) site.
Lenzing’s absolute scope 3 GHG emissions increased by 0.16 million tons (11 percent) year on year. The main reasons for the increase are higher amounts of purchased goods and services as well as higher values in upstream and downstream logistics. This was triggered by higher production volumes of pulp and fiber as well as longer distance transportation routes (red sea crises).
Despite an 11 percent year-on-year increase in absolute scope 1, 2, and 3 GHG emissions within the target scope (0.33 million tons), the specific scope 1, 2, and 3 GHG emissions per ton of fiber and pulp produced remained at the same level.
Specific scope 1, 2, and 3 GHG emissions per ton of fiber and pulp sold increased slightly to 2.14 tons CO2 eq./tons in 2024. Despite this increase, the remuneration target for 2024 was achieved.
|
|
|
|
|
Retrospective |
|||||||||||||
Absolute emissions (million tons CO2 eq.) |
2017 |
2021 (base year) |
2024 |
2023 |
2022 |
% |
||||||||||||
|---|---|---|---|---|---|---|---|---|---|---|---|---|---|---|---|---|---|---|
Scope 1 GHG emissions |
|
|
|
|
|
|
||||||||||||
Gross scope 1 GHG emissionsb |
1.33 |
1.24 |
1.28 |
1.17 |
1.09 |
10 |
||||||||||||
% of scope 1 GHG emissions from regulated emission trading schemes (%) |
23 |
20 |
15 |
14 |
20 |
11 |
||||||||||||
Scope 2 GHG emissions |
|
|
|
|
|
|
||||||||||||
Gross location-based scope 2 GHG emissions |
|
|
0.80 |
|
|
|
||||||||||||
Gross market-based scope 2 GHG emissions |
0.63 |
0.53 |
0.40 |
0.34 |
0.35 |
18 |
||||||||||||
Total gross scope 1 and scope 2 GHG emissions (market-based)c,d |
1.96 |
1.77 |
1.69 |
1.51 |
1.44 |
11 |
||||||||||||
Significant scope 3 GHG emissions |
|
|
|
|
|
|
||||||||||||
Total gross indirect scope 3 GHG emissionse |
1.96 |
1.88 |
1.54 |
1.38 |
1.50 |
11 |
||||||||||||
C1: purchased goods and servicesf |
1.35 |
1.31 |
0.92 |
0.80 |
1.00 |
15 |
||||||||||||
C3: fuel- and energy-related activities |
0.30 |
0.28 |
0.25 |
0.27 |
0.23 |
-9 |
||||||||||||
C4: upstream transportation and distribution |
0.12 |
0.11 |
0.14 |
0.10 |
0.12 |
37 |
||||||||||||
C9: downstream transportation |
0.12 |
0.12 |
0.19 |
0.17 |
0.11 |
13 |
||||||||||||
C15: investments |
0.07 |
0.06 |
0.04 |
0.04 |
0.05 |
0 |
||||||||||||
Total scope 1, 2, 3 GHG emissions |
|
|
|
|
|
|
||||||||||||
Total GHG emissions (location-based) |
|
|
3.62 |
|
|
|
||||||||||||
Total GHG emissions (market-based) |
3.92 |
3.65 |
3.23 |
2.90 |
2.94 |
11 |
||||||||||||
Total biogenic CO2 emissions, scope 1 |
|
1.74 |
3.29 |
3.10 |
1.67 |
6 |
||||||||||||
|
||||||||||||||||||
Total GHG emissionsa in million tons CO2 e q. per revenue (mn t/EUR) |
2024 |
2023 |
2022 |
% |
||
|---|---|---|---|---|---|---|
GHG emissions intensity (location-based) |
0.00136 |
|
|
|
||
GHG emissions intensity (market-based) |
0.00121 |
0.00115 |
0.00115 |
5% |
||
|
||||||
Absolute emissions of target scopeb,c (million tons CO2 eq.) and absolut emissions indexd (new SBT, 2021=100%) |
2017 |
2021 (base year) |
2024 |
2023 |
2022 |
Near-term SBT 2030d |
Long-term SBT 2050d |
||||||||
|---|---|---|---|---|---|---|---|---|---|---|---|---|---|---|---|
Absolute scope 1 and 2 GHG emissions |
1.96 |
1.77 |
1.69 |
1.51 |
1.44 |
1.03 |
|
||||||||
Absolute scope 3 GHG emissions |
1.89 |
1.82 |
1.49 |
1.34 |
1.45 |
1.37 |
|
||||||||
Absolute scope 1, 2 and 3 GHG emissions |
3.85 |
3.59 |
3.18 |
2.85 |
2.89 |
|
0.36 |
||||||||
Scope 1 and 2 index |
111% |
100% |
95% |
85% |
81% |
58% |
|
||||||||
Scope 3 index |
104% |
100% |
82% |
74% |
80% |
75% |
|
||||||||
Scope 1, 2 and 3 index |
107% |
100% |
89% |
79% |
80% |
|
10% |
||||||||
|
|||||||||||||||
In accordance with the European Sustainability Reporting Standards (ESRS), Lenzing has updated its GHG intensity metrics to ensure compliance. A new metric, “million tons CO2 eq. per EUR revenue” has been calculated in line with ESRS, see table “Greenhouse gas emissions intensity”. The previous specific GHG metrics of “tons CO2 eq. per ton fiber & pulp sold” and “tons CO2 eq. per ton fiber & pulp produced”, both in absolute terms and as a percentage relative to the base year 2017, have been retained due to the near-term SBT target.
Specific emissionsb,c (million tons CO2 eq. per ton fiber & pulp sold) and indexe |
2017 (base year)d |
2021 |
2024 |
2023 |
2022 |
Target 2024e |
|
|
||||||||||
|---|---|---|---|---|---|---|---|---|---|---|---|---|---|---|---|---|---|---|
Specific scope 1, 2 and 3 emissions |
3.61 |
3.28 |
2.14 |
1.94 |
3.01 |
|
|
|
||||||||||
Specific scope 1, 2 and 3 emissions index (2017 = 100%) |
100% |
91% |
59% |
54% |
83% |
60% |
|
|
||||||||||
|
|
|
|
|
|
|
|
|
||||||||||
Specific emissionsb,c (million tons CO2 eq. per ton fiber & pulp produced) and indexe |
2017 (base year)d |
2021 |
2024 |
2023 |
2022 |
Target 2025e |
Target 2026e |
Target 2027 |
||||||||||
Specific scope 1, 2 and 3 emissions |
2.59 |
2.38 |
1.49 |
1.49 |
2.11 |
|
|
|
||||||||||
Specific scope 1, 2 and 3 emissions index (2017 = 100%) |
100% |
92% |
58% |
58% |
82% |
55% |
53% |
50% |
||||||||||
|
||||||||||||||||||
Accounting principles
ESRS 2 MDR-M, E1-5, E1-6]
GHG emission calculation for scope 1, 2 and 3 follows the corresponding standards and guidances of the GHG protocol.
Local sites report energy and fuel input data, as well as emissions factors and calorific values to the Group database on a monthly basis. On both the site- and the group-level, energy and GHG accounting follows the GHG protocol and ESRS E1 requirements. The accounting principles are disclosed based on the ESRS terminology.
Calorific values und emissions factors used by EU sites are the same as those used for disclosures under the EU Emission Trading Scheme. Non-EU sites may use measured emission factors or literature values according to local legal requirements. Otherwise, references to IPCC are used.
Energy consumption for Lenzing’s own operations is measured as the input of purchased electric power, heat (steam), and fuel, monitored by meter readings or invoices based on the direct quantification of fuels. Fuel quantities are multiplied with calorific values to calculate energy consumption (in MWh).
Energy intensity is based on Lenzing’s total energy consumption per revenue from activities in high climate-impact sectors. The high climate-impact sectors relevant to Lenzing are manufacturing of man-made cellulose fibers and dissolving wood pulp. For the revenue used in this calculation, please refer to the table “Revenue from external customers by products and services” in the “notes”, where the sum of the line items “Division Fiber” and “Division Pulp” is used. The energy consumption of the revenue category “Others” was not excluded from the total energy consumption, as their impact on the indicator is not significant. “Others” mainly includes central headquarters functions, overarching activities, and BZL’s business activities (training and personnel development). Energy intensity is reported as MWh/EUR.
Scope 1 GHG emissions include direct GHG emissions at Lenzing’s production sites. For their calculation, the quantity of the fuel consumed is multiplied by suitable emission factors (see section “calorific values and emissions factors”).
Scope 2 GHG emissions include all indirect emissions related to the generation of acquired and consumed electricity and heat. All consumed energy is monitored by meter readings or invoices.
Location-based accounting involves multiplying the energy consumed from the public grid by relevant location-based emission factors, which typically reflect residual mixes. These factors are obtained from the IPCC 2021 GWP100 V1.02 (country and regional data). Market-based accounting considers the energy source of purchased electricity/heat and corresponding emission factors, which are provided by public traders and substantiated by Energy Attribute Certificates, such as Guarantees of Origin or Renewable Energy Certificates (REC). As in the market-based approach, steam and electricity at the Prachinburi (Thailand) and Grimsby (UK) sites as well as steam at the Nanjing (China) site is multiplied with supplier-specific information. Supplier data and information is based on regulations and the IPCC. For the calculation of the scope 2 GHG emissions, which are included in the target scope, a market-based method was used.
Scope 3 GHG emissions refer to all other indirect emissions within the accounting scope. Lenzing identified five significant/material categories out of 15 defined by the GHG Protocol: category 1 “Purchased Goods and Services”, category 3 “Fuel- and energy-related activities (not included in scope 1 or scope 2)”, categories 4 and 9 “Upstream and Downstream Transportation and Distribution” and category 15 “Investments”. The SBT target scope includes categories 1, 3, 4 and 9 but excludes category 15 (97 percent scope 3 covered by target). The scope 3 categories contain estimates of the value chain. The relevant categories have an estimation accuracy of 2 (1 – exact figure, 2 – calculation / exact estimate, 3 – rough estimate).
Scope 3 category 1: Lenzing’s purchased goods and services are calculated using the supplier-specific method as well as the average data method. Lenzing’s purchased goods and services are calculated using three subcategories:
- Wood harvesting: The calculations are based on supplied round wood multiplied with Ecoinvent emission factors
- Purchased external pulp: The calculations based on purchased volumes and Supplier LCA data.
- Purchased chemicals: The calculations are based on volumes of purchased chemicals multiplied in part with generic emission factors from Ecoinvent and in part with data provided by suppliers. Supplier specific data share is 42 percent of scope 3 category 1 emissions.
Scope 3 category 3: Fuel- and energy-related activities (not included in scope 1 or scope 2) are calculated using average data. GHG emissions generated during extraction and processing of fuels (coal, natural gas, biomass etc.) are derived from fuel consumption and Ecoinvent emission factors.
Scope 3 category 4: Lenzing’s upstream transport includes purchased external pulp, round wood and purchased chemicals. The distance-based method was applied – transport volumes, transport routes and transportations modes are obtained from the ERP logistics system. Emission factors are derived from EcoTransIT.
Scope 3 category 9: Lenzing’s downstream transport includes fiber and pulp sold as well as by-products (sodium sulfate, acidic acid, furfural, soda, etc.). The distance-based method was applied – transport volumes, transport routes and transportations modes are obtained from the ERP logistics system. Emission factors are derived from EcoTransIT.
Scope 3 category 15: Lenzing’s equity investments are calculated using the investment-specific method – publicly available data, such as sustainability reports or the EU ETS register, are used.
The following scope 3 categories are relevant but not material: category 2 (capital goods), category 5 (waste generated in operations), category 6 (business travel), category 7 (employee commuting) and category 8 (upstream leased assets) – therefore these categories are excluded from the inventory.
Scope 3 category 10 (processing of sold products): In line with the GHG protocol scope 3 guidance, Lenzing excluded this category from the inventory. Lenzing is a producer of intermediate products and has no visibility and no control/influence over processing of Lenzing’s products after sale. For example, Lenzing products end up in many potential downstream applications, each with potentially different GHG emission profiles. The GHG emissions associated with further processing depend not only on the technical method used but also on the location and setup of the processor. For example, a spinning mill with a 100 percent renewable energy supply has minimal Scope 1 and 2 emissions, while a spinning mill using 100 percent coal-fired electricity has high scope 1 and 2 emissions. It is therefore not reasonably possible to estimate GHG emissions associated within category 10. Moreover, as an intermediate supplier, Lenzing does not have control or influence over operational and financial decisions in this category to reduce GHG emissions.
The following scope 3 categories are not relevant: category 11 (use of sold products), category 12 (end-of-life treatment of sold products), category 13 (downstream leased assets) and category 14 (franchises).
GHG emissions intensity is based on total location-based and market-based GHG emissions as well as the revenue from the financial statement, and refers to the line item “Revenue as per consolidated income statement”. For the revenue used in this calculation, please refer to the table “Revenue from external customers by products and services” in the “notes”.
External assurance provider
The metrics reported in the sections “Energy and fuels” and “Lenzing’s greenhouse gas emissions” are not subject to additional external verification other than the Sustainability Report assurance process.
Recalculation of 2017, 2021, 2022, and 2023 scope 1 GHG emissions
The recalculation of scope 1 GHG emissions for 2017, 2021, 2022, and 2023 in the reporting year is due to a regulatory change at the Lenzing site in Austria. Previously, the fossil share of external waste burned at the site was estimated, but it is now based on direct measurements. Since the measured fossil share is higher than the estimate, this increases the fossil scope 1 GHG emissions and proportionally reduces the biogenic scope 1 GHG emissions by about 160 to 170 kilotons of CO2.
Internal carbon price
[ESRS E1-8]
Since 2021, an internal carbon price (ICP) of EUR 75 per ton of CO2 has been applied in the strategic investment planning process. This ICP is added on top of regulatory carbon pricing and is uniformly applied across all Lenzing locations for scope 1 and 2 CO2 emissions. It is used as a shadow price (virtual cash outflow) for future CapEx projects exceeding EUR 2 million, with two business cases calculated: one including the ICP and one excluding it. The adjusted Internal Rate of Return (IRR) including the ICP is used for project prioritization. The purpose of the ICP is to mitigate future carbon risks, to encourage the preference of renewable fuels over fossils and to induce energy efficiency projects. The carbon price is derived from benchmarks against peers and a theoretical carbon price of USD 50-100 per ton of CO2 (from the The High-Level Commission on Carbon Pricing and Competitiveness) aligned with the 1.5 °C target. The use of the ICP in the strategic investment planning process affects the Internal Rate of Return (IRR), a key ranking criterion among projects, and is not used for margins and yields.