Sustainability key performance indicators
[voluntary information]
Topic |
Unit / Method |
2025 |
2024 |
||||||||||||||
|---|---|---|---|---|---|---|---|---|---|---|---|---|---|---|---|---|---|
Raw material security |
|
|
|
||||||||||||||
Share of certified and controlled wood |
FSC® / PEFC |
100% |
100% |
||||||||||||||
|
|
|
|
||||||||||||||
Sustainable innovations |
|
|
|
||||||||||||||
R&D expenditure |
Frascati Method (EUR) |
EUR 31.7 mn |
EUR 30.4 mn |
||||||||||||||
Share of speciality fibers |
% of fiber revenue |
92.0% |
92.6% |
||||||||||||||
Specific2 sulfur emissions to air |
kg/t, 2014 = 100% |
14% |
17% |
||||||||||||||
Water intensity3 |
m3/EUR mn revenue |
6,272 |
5,075 |
||||||||||||||
Specific2 water emissions after wastewater treatment COD |
Index based on kg/t, 2014 = 100% |
60% |
71% |
||||||||||||||
|
|
|
|
||||||||||||||
Decarbonization |
|
|
|
||||||||||||||
GHG intensity4 |
t CO2 eq./EUR revenue |
0.00110 |
0.00121 |
||||||||||||||
Index based on t CO2 eq./t, 2017 = 100% |
52% |
58% |
|||||||||||||||
|
|
|
|
||||||||||||||
Employees |
|
|
|
||||||||||||||
Number of employees |
Austria, Czech Republic, UK, USA, China, Indonesia, India, Taiwan, Thailand, Türkiye, Korea, Singapore, Brazil, Germany, Italy, France |
8,129 |
8,228 |
||||||||||||||
Women in management positions |
% total positions, 2022 = 19.7% |
21.9% |
22.8% |
||||||||||||||
|
|
|
|
||||||||||||||
Health & safety |
|
|
|
||||||||||||||
Total Recordable Injury Frequency Rate (TRIFR) of employees |
Per 1 mn hours worked |
4.5 |
5.5 |
||||||||||||||
|
|
|
|
||||||||||||||
Partnering for systemic change |
|
|
|||||||||||||||
Suppliers with sustainability assessment – procurement spent covered7 |
% of total spend |
68% |
60% |
||||||||||||||
|
|||||||||||||||||
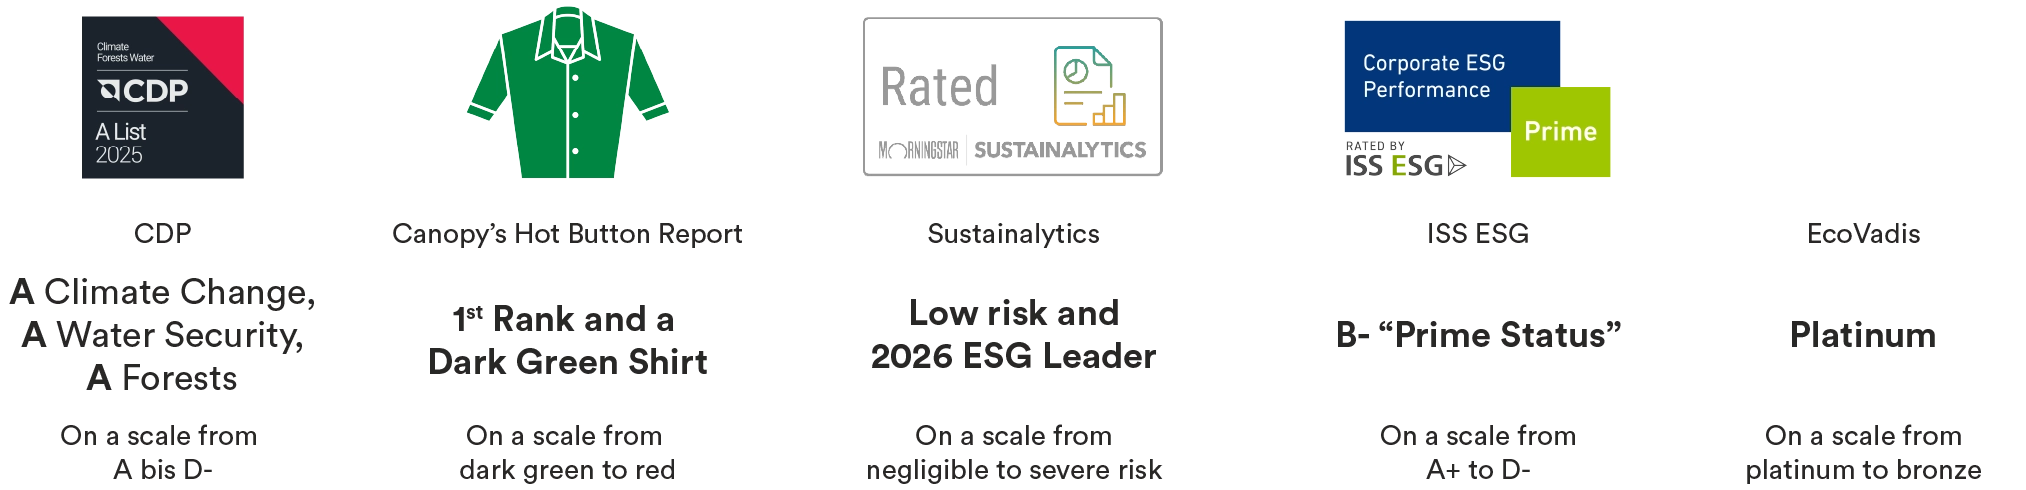
Ratings